
.
Julio Bermudez
School of Architecture and Planning
The Catholic University of America
Recent Research II

.
Julio Bermudez
School of Architecture and Planning
The Catholic University of America
Recent Research II
........
... .
.
....
bermudez@cua.edu
school of arch and plan
....
....
....
....
....
....
....
....

....
....
....
....
....

....
....
....
....
....
.
....
....
....
.
 ....
....
....
....
.
This interdisciplinary work on Information Visualization Design research covers four interrelated areas of application within the umbrella of the State of Utah funded Center of Excellence CROMDI. For a summary document of this investigation, click here (2004-05 ACSA Creative Achievement Award).
Medicine (1997-2004) (over $ 2.3M in grants)
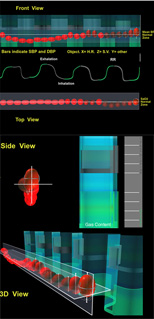
| Visual Representation of Integrated Physiologic Data in Real Time
Description
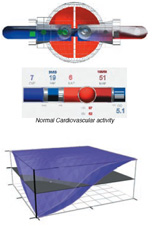
Making quick and accurate decisions in complex and rapidly changing environments is a major concern in many fields. Not only is the management of information essential, but the fast discrimination of relevant data is critical. Data representation design is of paramount importance as a means of augmenting human ability to make informed, rapid, and correct diagnosis and decisions. This research seeks to create a new representation model that will significantly improve the medical diagnosis of disease states or life threatening physiologic changes. Basic principles of 2D and 3D design (e.g., scale, shape, rhythm, balance, color, unity, etc.) will be used to create a visual representation model to organize physiologic data. The result will be an integrated and interactive multisensory information system that replaces numerical or wave-form data displays. The research focuses on data visualization design and uses technology as its instrument to deliver this goal. A design model to visually represent physiologic data will be developed and tested using a prototype. The testing will be conducted in the simulated environment of the Utah Center for Patient Simulation. In the Center we will recreate the stressful environment of the operating room and simulate the patient at risk because of a critical event. By measuring the test subjects' quickness in identifying critical events with and without our representation system, we will have a strong argument to grant additional funding for this research. The research ideas and results may apply to areas outside medicine and thus contribute to a theory and design of new data representations for enhancing human capacity to respond to critical conditions within real time complex data environments. Investigators Funding |
| Art Performance (1995-2005) (over $ 10K in grants) The cyberPRINT Project
Description
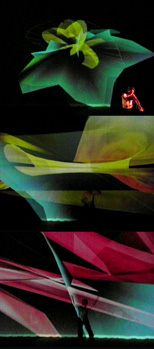
The cyberPRINT is the architectural representation in digital space of an individual's "lifespace" in real time. The cyberPRINT is both a probing and representational system that brings together science and art through architectural design. Architecture provides the conceptual and visual tools for representing the complexities of an individual's body which currently can only be seen through separate and non-visual monitoring devices. The cyberPRINT allows us to visualize the complex and unfolding nature of being alive. The cyberPRINT was first shown as of part of "Body Automatic Body Resistant", a techno-media event directed by internationally renown multimedia choreographer and artist Yacov Sharir. It took place at the Salt Lake City Repertoire Dance Theater as part of its 1999-2000 Millennium Season in May 2000. The premiere of the cyberPRINT was the first production of its kind in the US and probably the world. Since then, the cyberPRINT was performed in a diversity of venues in the U.S. (California, Connecticut, Texas, Ohio, etc.) and abroad (Monaco, Canada, Brazil, and Argentina) Investigators Equipment Support,Consulting and Funding by Cleveland Medical Devices, Inc. Funding More Information (Publication 1) |
| Finance (1999-2003) ($ 75K in grants) Visual Representation of Integrated Financial Data in Real Time
Description
Investment professionals and individuals have access to a wealth of information about companies, real-time, historical and comparative market data. However, making rapid decisions is limited by their inability to monitor and analyze large amounts of data. Their decision making can benefit from new tools that allow to monitor not just single information, but multiple data sets, and relationships among them, presented on one screen in a clear and concise format. The state of the art of data visualization in Finance use linear models assuming linearity and other limiting paradigms. In addition, current data representations techniques (e.g., waveforms, pie charts, diagrams, etc.) have limitations when dealing with large amounts of data. Our research team has developed a new visualization technology (IntuInfo+) that facilitates the rapid and accurate analysis of large quantities of complex and quickly changing data. IntuInfo+ is designed to represent vast streams of abstract information as produced in industrial processes, business activities and the human body. The technology maps data variables into 3D objects and their properties, which enables significantly faster, more accurate and less cognitive demanding recognition of events than with traditional representations. This patent-pending technology may be successfully applied to finance, The goal is to provide an unique way to find insight and patterns in complex financial data. Investigators Funding |
| Defense/Network Monitoring & Intrusion Detection (2002-2005) ($ 882,600 in grants) Cyber-Security visualization for increased Situational Awareness + Intuitive visual representation of network events to improve decision making
Description
The health and security of information networks is a priority for science, engineering and society today. In a typical situation, a single engineer is responsible for a network, chooses among a plethora of software that substantially vary in purpose, complexity, and price, customizes a dashboard, and learns while working. Although countless tools have been developed to visualize the hierarchy of data structures, there is still no good information visualization model that adequately presents the extensive data volume that needs to be depicted while reducing its complexity without obscuring important data. Our work takes on this challenge by a combination of synthetic reductions through spatial and temporal data scaling and layering, referential frameworks, and typological and topological data mapping. By offering a viewing device supporting both analytical and exploratory decision making, our data representation architecture presents critical events in ways that are easier to detect, diagnose and deal with. Such visualization research effort may provide a complementary vision of network operations than the one coming out of many pure Computer Science Network Research efforts. Another goal of this project is to develop data visualization that will consistently allow less experienced network operators detect early and diagnose accurately network abnormalities. Investigators Funding |
| Technology Development & Commercialization (2000-2007) ($ 677,000 in grants) Center for the Representation of Multi-Dimensional Information (CROMDI)
Description
The above interdisciplinary research work on Information Visualization Design were developed under the umbrella of the State of Utah funded Center of Excellence The Centers of Excellence Program (COEP) funds the commercialization of technologies developed in Utah's institutions of higher education. The work of CROMDI is aimed toward developing commercializable technologies in the four areas described: medicine, finance, network monitoring, and art & entertainment. CROMDI's long term goal is to develop the standard design paradigm for the representation of multi-dimensional information, that can be widely licensed and adopted by developers of decision support applications. An analogy would be the development of the graphical user interface for computers: the concept of desktop, window, icons, and several other tools and controls have become a standard reference in all computer applications and adopted by software manufacturers. Among others, CROMDI's specific objectives are:
CROMDI Main Investigators Funding Spin-off Company |
|
2002-07 Royalties to U from Cardio Cardiovascular Display License ($150,000)
2002-07 Royalties to U from Drug Display 2 SubLicenses ($300,000) 2002-05 SubContracts to U from Medvis, Inc. ($200,000) 2005 ... Drug Display Sublicense to GE ($300,000) 2003 .... Drug Display SubLicense to Docusys ($35,000) 2002 ... Drug Display Licence to Medvis, Inc. ($35,000) 2002 ... Cardiovascular Display License to GE ($150,000) |